| Simple Profiler |
Here is a short description of the Profiler class
This topic contains the following sections:
The Profiler class provides following features:
- Measure code execution time.
- Collect interesting values, like "How many collisions happened in this frame?", "How many iterations did this algorithm make?", etc.
- Compute minimum, average and maximum values.
- The profiler is thread-safe.
- Do not influence performance in release builds – only in profiling builds of the game.
The Profiler class can be found in the namespace DigitalRune.Diagnostics. Here is a class diagram of the relevant classes.
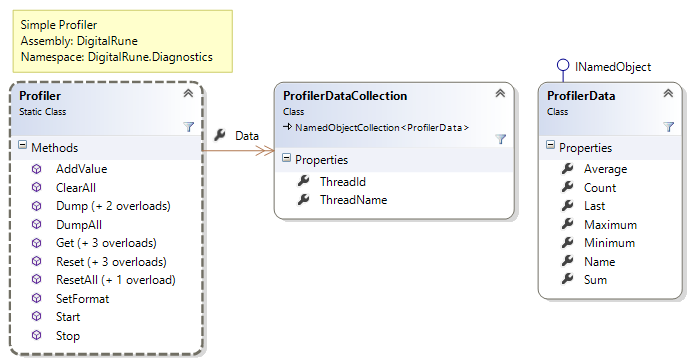
The Profiler class itself is a static class. The important methods are marked with a ConditionalAttribute and they are only executed when the conditional compilation symbol DIGITALRUNE_PROFILE is defined in the profiled application. This way, it is not necessary to remove the profiling code before the application is released – only remove the conditional compilation symbol.
The Profiler stores several ProfilerDataCollections - one collection per thread. Each collection is a NamedObjectCollectionT of ProfilerData. Each ProfilerData has a name and stores the minimum, average, maximum, etc. of the collected samples.
To measure time you can call ProfilerStart and ProfilerStop. The profiler measures the time between Start and Stop and stores the value in the ProfilerData for this name.
Instead of using Start/Stop you can measure the time yourself and call AddValue to add a value to the ProfilerData for the given name.
You can use the Profiler not only for time measurement, but also for collecting other data. For example, if you want to know how many collisions are happening in each frame of your game, you can count the number of collisions and call Profiler.AddValue("CollisionsPerFrame", numberOfCollisions). The Profiler will create a ProfilerData instance with the name "CollisionsPerFrame" and keep track of the minimum, average, maximum number of collisions per frame.
You can evaluate the collected data manually using the Get methods or by enumerating the ProfilerDataCollections. You can also call DumpAll to get a string with the collected statistics. Using SetFormat you can control how the data is formatted in DumpAll.
The Profiler is thread-safe. Data from different threads are collected in different ProfilerDataCollections. If different threads call Profiler.AddValue("MyValue", x), the values of the different threads are not combined.
The following example executes a method Foo in a sequential and in a parallel loop. The method Foo generates 10000 random numbers between 0 and 100 and counts how many numbers are below 10. Several interesting times and values are collected using the Profiler class:
// The compilation symbol "DIGITALRUNE_PROFILE" must
// be defined to activate profiling.
#define DIGITALRUNE_PROFILE

using System;
using DigitalRune.Diagnostics;
using DigitalRune.Threading;

namespace ProfilingTest
{
  class Program
  {
    static void Main(string[] args)
    {
      // Warmstart: We call Foo and the Parallel class so that all one-time initializations are
      // done before we start measuring.
      Parallel.For(0, 100, i => Foo());
      Profiler.ResetAll();

      // Measure time of a sequential for-loop.
      Profiler.Start("MainSequential");
      for (int i = 0; i < 100; i++)
        Foo();
      Profiler.Stop("MainSequential");

      // Measure time of a parallel for-loop.
      Profiler.Start("MainParallel");
      Parallel.For(0, 100, i => Foo());
      Profiler.Stop("MainParallel");

      // Format the output by defining a useful scale. We add descriptions, so that any other
      // person looking at the output can interpret them more easily.
      Profiler.SetFormat("MainSequential", 1e3f, "[ms]");
      Profiler.SetFormat("MainParallel", 1e3f, "[ms]");
      Profiler.SetFormat("Foo", 1e6f, "[µs]");
      Profiler.SetFormat("ValuesBelow10", 1.0f / 100.0f, "[%]");

      // Print the profiling results.
      Console.WriteLine(Profiler.DumpAll());
    }


    public static void Foo()
    {
      Profiler.Start("Foo");

      var random = new Random();
      int numberOfValuesBelow10 = 0;
      for (int i = 0; i < 10000; i++)
      {
        int x = random.Next(0, 100);
        if (x < 10)
          numberOfValuesBelow10++;
      }

      // Profilers can also collect other interesting numbers (not only time).
      Profiler.AddValue("ValuesBelow10", numberOfValuesBelow10);

      Profiler.Stop("Foo");
    }
  }
}
Here is the output of this program:
Thread:  (#1)
Name              Calls      Sum          Min        Avg        Max Description
-------------------------------------------------------------------------------
Foo                 100  42433.400    411.200    424.334    530.300 [µs]
ValuesBelow10       100    986.480      9.480      9.865     10.110 [%]
MainSequential        1     42.483     42.483     42.483     42.483 [ms]
MainParallel          1     14.133     14.133     14.133     14.133 [ms]
Thread: Parallel Worker 0 (#3)
Name              Calls      Sum          Min        Avg        Max Description
-------------------------------------------------------------------------------
Foo                  32  12948.000    362.500    404.625   1477.600 [µs]
ValuesBelow10        32    329.530     10.040     10.298     10.370 [%]
Thread: Parallel Worker 1 (#4)
Name              Calls      Sum          Min        Avg        Max Description
-------------------------------------------------------------------------------
Foo                  36  13376.200    359.800    371.561    436.200 [µs]
ValuesBelow10        36    369.690     10.040     10.269     10.370 [%]
Thread: Parallel Worker 2 (#5)
Name              Calls      Sum          Min        Avg        Max Description
-------------------------------------------------------------------------------
Foo                  32  13572.100    412.000    424.128    497.200 [µs]
ValuesBelow10        32    328.540     10.040     10.267     10.370 [%]
Thread: Parallel Worker 3 (#6)
Name              Calls      Sum          Min        Avg        Max Description
-------------------------------------------------------------------------------
Foo                   0          -          -          -          - [µs]
ValuesBelow10         0          -          -          -          - [%]
The output tells us several useful things:
- There is one table per thread. The unnamed thread is the main thread of the application. We see that the Parallel.For() call has created 4 worker threads.
- The output shows how often the measured code parts where executed. For example, Foo() was executed 100 times in the main thread, 32 times in the "Parallel Worker 0" thread, etc. The thread "Parallel Worker 3" didn’t have to do any of the work. We can now reason whether it is okay that Parallel Worker 3 didn’t to anything. Shouldn’t the worker be equally distributed among all threads? (Note: Actually, it is ok and does not indicate a problem.)
- MainParallel is about 3 times faster than MainSequential. That’s not bad, though it could be faster on my quad core processor.
- The table also shows the Sum/Min/Average/Max of the measured times. Some times are measured in µs and some in ms. This was set using Profiler.SetFormat().
- In each execution of Foo() a lot of random values are created and in the ProfilerData "ValuesBelow10" the percentage of numbers below 10 are recorded. We expect this to be around 10%, and indeed the average on each thread is near 10. But something smells fishy: The Min and the Max on all but the first thread are exactly equal: Min = 10.04 and Max = 10.37. Isn’t that extremely unlikely? – Indeed, this is a problem: When the Random() constructor is called, it sets the random seed using the system clock and "as a result, different Random objects that are created in close succession by a call to the default constructor will have identical default seed values and, therefore, will produce identical sets of random numbers" (MSDN documentation).