| Hierarchical Profiler |
In this article, we talk about the second profiler, which is a "hierarchical profiler". It was inspired by an article in the book Real-Time Hierarchical Profiling (Game Programming Gems 3).
This class has slightly different goals than the Simple Profiler. The main goal is to measure the timing of nested method calls. This is extremely helpful in many applications – in particular if you need to optimize your game loop. An important difference between the simple profiler and the hierarchical profiler is that the hierarchical profiler does not work across multiple threads. That’s why we still need the simple profiler. The simple profiler can be used to collect values and to profile code in multi-threaded scenarios.
This topic contains the following sections:
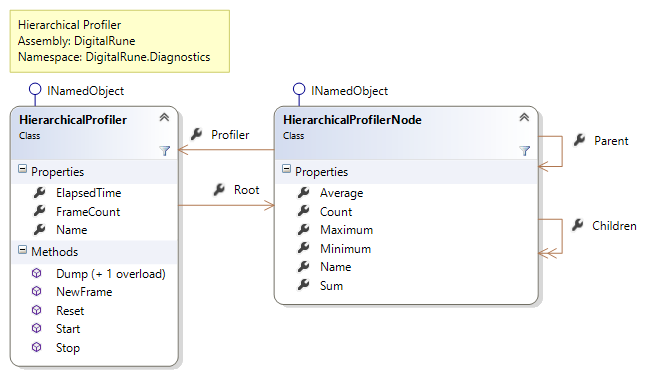
The HierarchicalProfiler class can be found in the namespace DigitalRune.Diagnostics. Here is a class diagram of the relevant classes.

Unlike the Profiler class, the HierarchicalProfiler is not a static class. You need to create a new instance of the HierarchicalProfiler, and this instance must not be shared across threads.
Time is measured with Start and Stop. This profiler allows nested time measurement – even for recursive calls! If Start("Foo") is called twice, without calling Stop. the profiler treats this as a recursive method call. If Start("Foo0") and then Start("Foo1") is called, the profiler assumes that Foo1 is a method called by Foo0. Thus, it builds a tree of profiler data. The root of the tree is Root. Each node in the tree is a HierarchicalProfilerNode and has other child nodes.
The method NewFrame must be called when a new frame of the game starts (= at the beginning of the game’s main loop, or at beginning of Game.Update in XNA). I guess it gets clearer with an example…
The following example "simulates" a game. Methods called Update and Draw are called in a loop. The Update method calls other methods to compute Physics and AI.
// The compilation symbol "DIGITALRUNE_PROFILE" must
// be defined to activate profiling.
#define DIGITALRUNE_PROFILE

using System;
using System.Threading;
using DigitalRune.Diagnostics;

namespace ProfilingTest
{
  class Program
  {
    // The profiler instance.
    private static HierarchicalProfiler _profiler = new HierarchicalProfiler("MyProfiler");

    static void Main(string[] args)
    {
      // Start profiling.
      _profiler.Reset();

      // This represents the main-loop of a game.
      for (int i = 0; i < 10; i++)
      {
        // NewFrame() must be called when a new frame of the game begins.
        _profiler.NewFrame();

        Update();
        Draw();
      }

      // Write the profiler data to the console. We start at the root node and include
      // up to 5 child levels.
      Console.WriteLine(_profiler.Dump(_profiler.Root, 5));
    }

    private static void Update()
    {
      _profiler.Start("Update");

      Physics();
      AI();
      AI();
      AI();
      Thread.Sleep(1);

      _profiler.Stop();
    }

    private static void Physics()
    {
      _profiler.Start("Physics");

      Thread.Sleep(6);

      _profiler.Stop();
    }

    private static void AI()
    {
      _profiler.Start("AI");

      Thread.Sleep(3);

      _profiler.Stop();
    }

    private static void Draw()
    {
      _profiler.Start("Draw");

      Thread.Sleep(4);

      _profiler.Stop();
    }
  }
}
Here is the console output:
MyProfiler.Root 20 frames 20.286ms/frame 405.721ms total
  Update 79.8% 16.198ms/frame 1 calls/frame (15.99ms/16.198ms/18ms)
    Physics 29.6% 6.003ms/frame 1 calls/frame (5.367ms/6.003ms/6.356ms)
    AI 45.1% 9.145ms/frame 3 calls/frame (2.389ms/3.048ms/5.107ms)
    Other 5.2% 20.977ms 1.049ms/frame
  Draw 19.6% 3.979ms/frame 1 calls/frame (3.514ms/3.979ms/4.683ms)
  Other 1.2% 4.919ms 245.97µs/frame
The dump uses a compacted format. The percentage values show the time of a node relative to the root of the dump. The values in round brackets are Minimum/Average/Maximum times. 'Other' represents the time of a node that was not measured by a child node. (If you don’t like the output format, you can traverse the tree manually, starting at the Root node, and collect the data that is relevant in your particular case.)
The output tells us a few things:
- The main loop of the game was executed 20 times. The average frame time is ~20ms. If we target a 60 fps game (= 16.6 ms/frame), we need to do some optimization.
- 79.9% of the whole game time is spent in Update(). Drawing accounts for 19.6% of the game time.
- AI uses 45.1% of the whole game time and is called 3 times per frame.
- ...