| Statistics and Visualization (Debugging) |
The OcclusionBuffer provides basic statistics (see OcclusionBufferStatistics). These can be used to evaluate the efficiency of the occlusion culling process.
Further, the OcclusionBuffer provides various methods for debugging visibility issues. The most common visibility problems are:
- Occluder geometry may be larger than the models in the scene. When occluders are not properly aligned with the scene, objects may be missing in the final image.
- When important occluders are missing, the performance will drop.
- Shadows may flicker or be missing in the final image.
The following methods can be used to visualize occluders and individual occlusion tests:
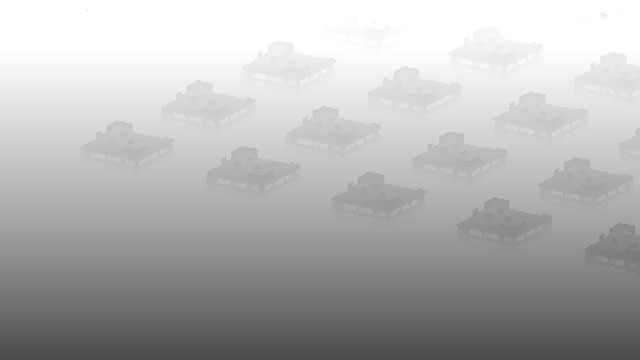
VisualizeCameraBuffer overlays a level of the HZB on top of the scene. This can be used to visualize occluders and compare them with the actual scene.
 Figure: HZB (level 0 - 7)
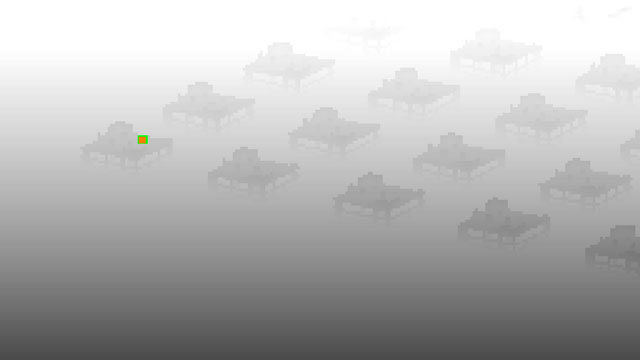
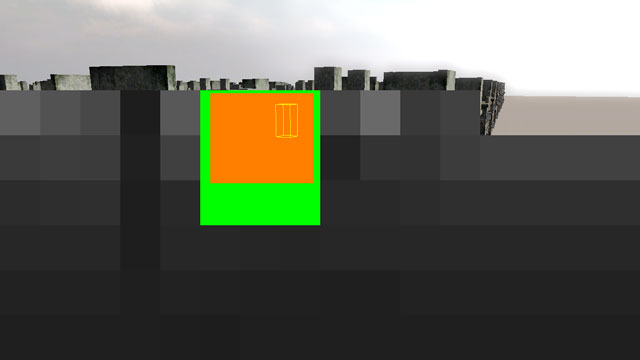
VisualizeObject visualizes a single occlusion test. The bounds of a scene node are compared with the depth values at a specific level in the HZB. An orange rectangle designates the screen-aligned bounds of the object. A green rectangle shows the area that is sampled in the HZB.
 Figure: Object vs. HZB
VisualizeLightBuffer renders HZB of the directional light. This is the same as VisualizeCameraBuffer except the scene is shown from the light's point of view. (Only available when shadow caster culling is active.)
 Figure: HZB (level 0) of light source
VisualizeShadowCaster visualizes the occlusion test of a specific shadow caster in the HZB of the directional light. An orange rectangle designates the screen-aligned bounds of the shadow caster. A green rectangle shows the area that is sampled in the HZB. (Only available when shadow caster culling is active.)
 Figure: Shadow caster vs. light HZB
VisualizeShadowVolume visualizes the occlusion test of the shadow volume of a specific shadow caster. An orange rectangle designates the screen-aligned bounds of the shadow volume. A green rectangle shows the area that is sampled in the HZB. (Only available when shadow caster culling is active.)
 Figure: Shadow volume vs. camera HZB